Music Visualization
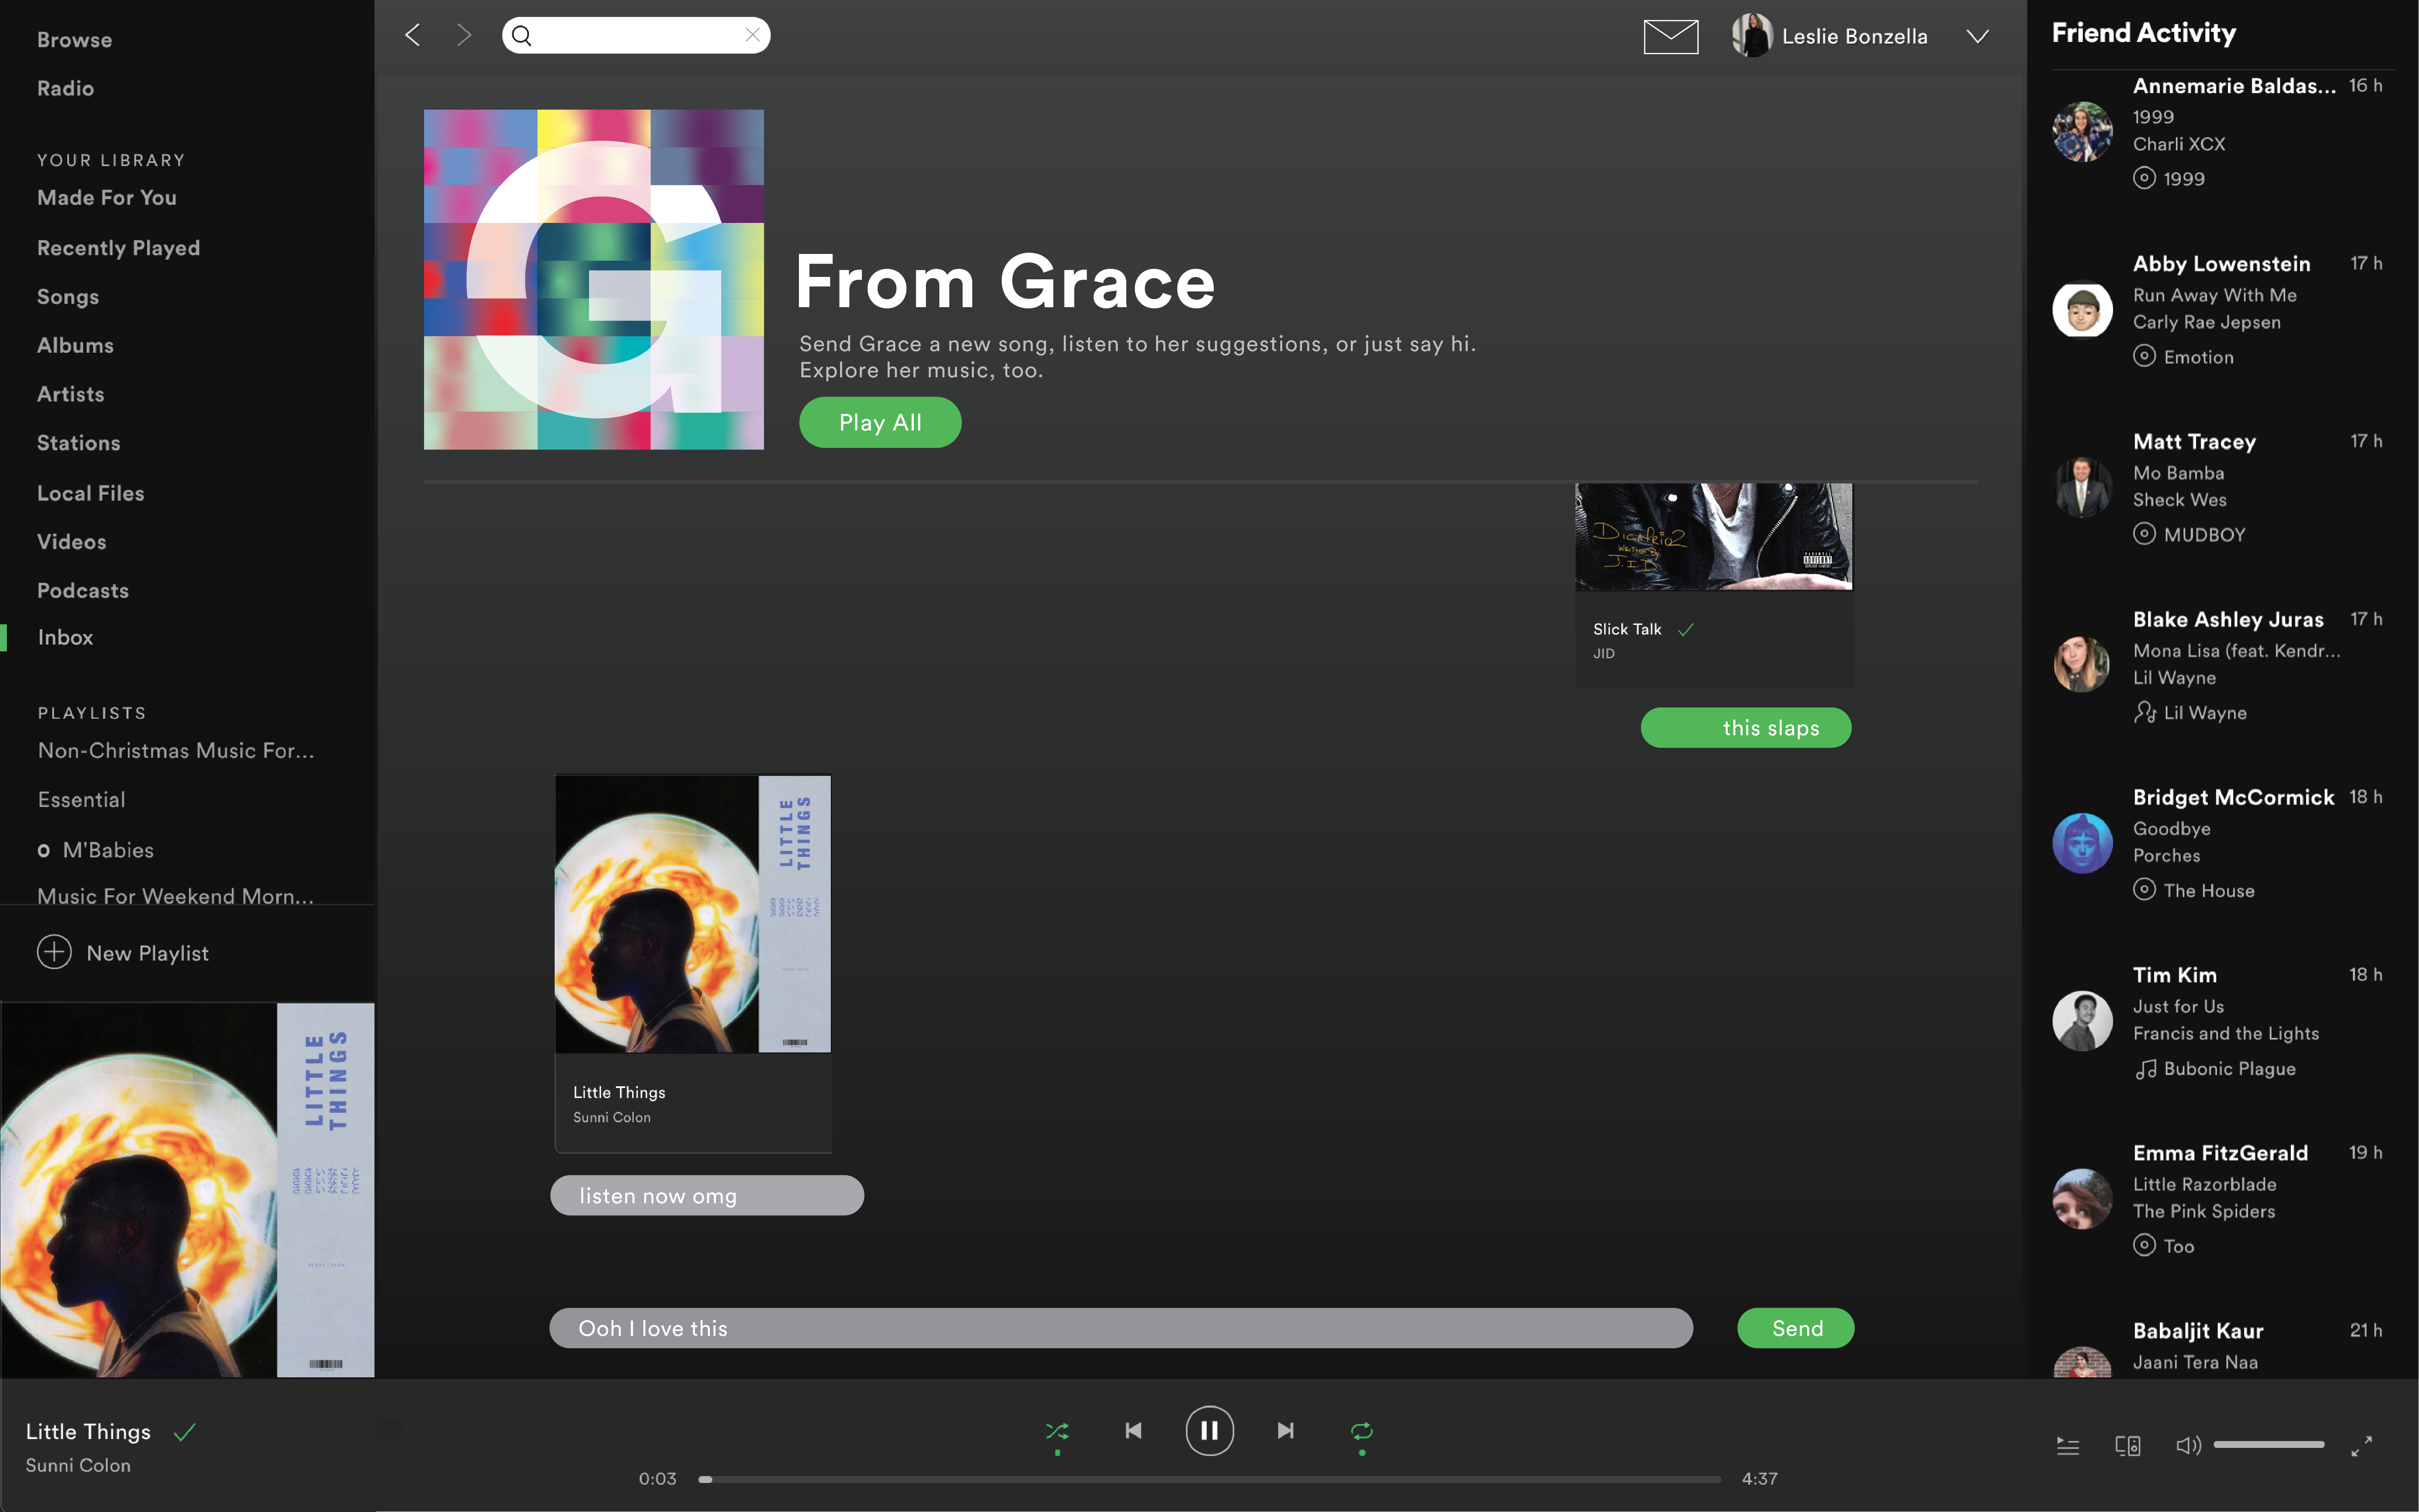
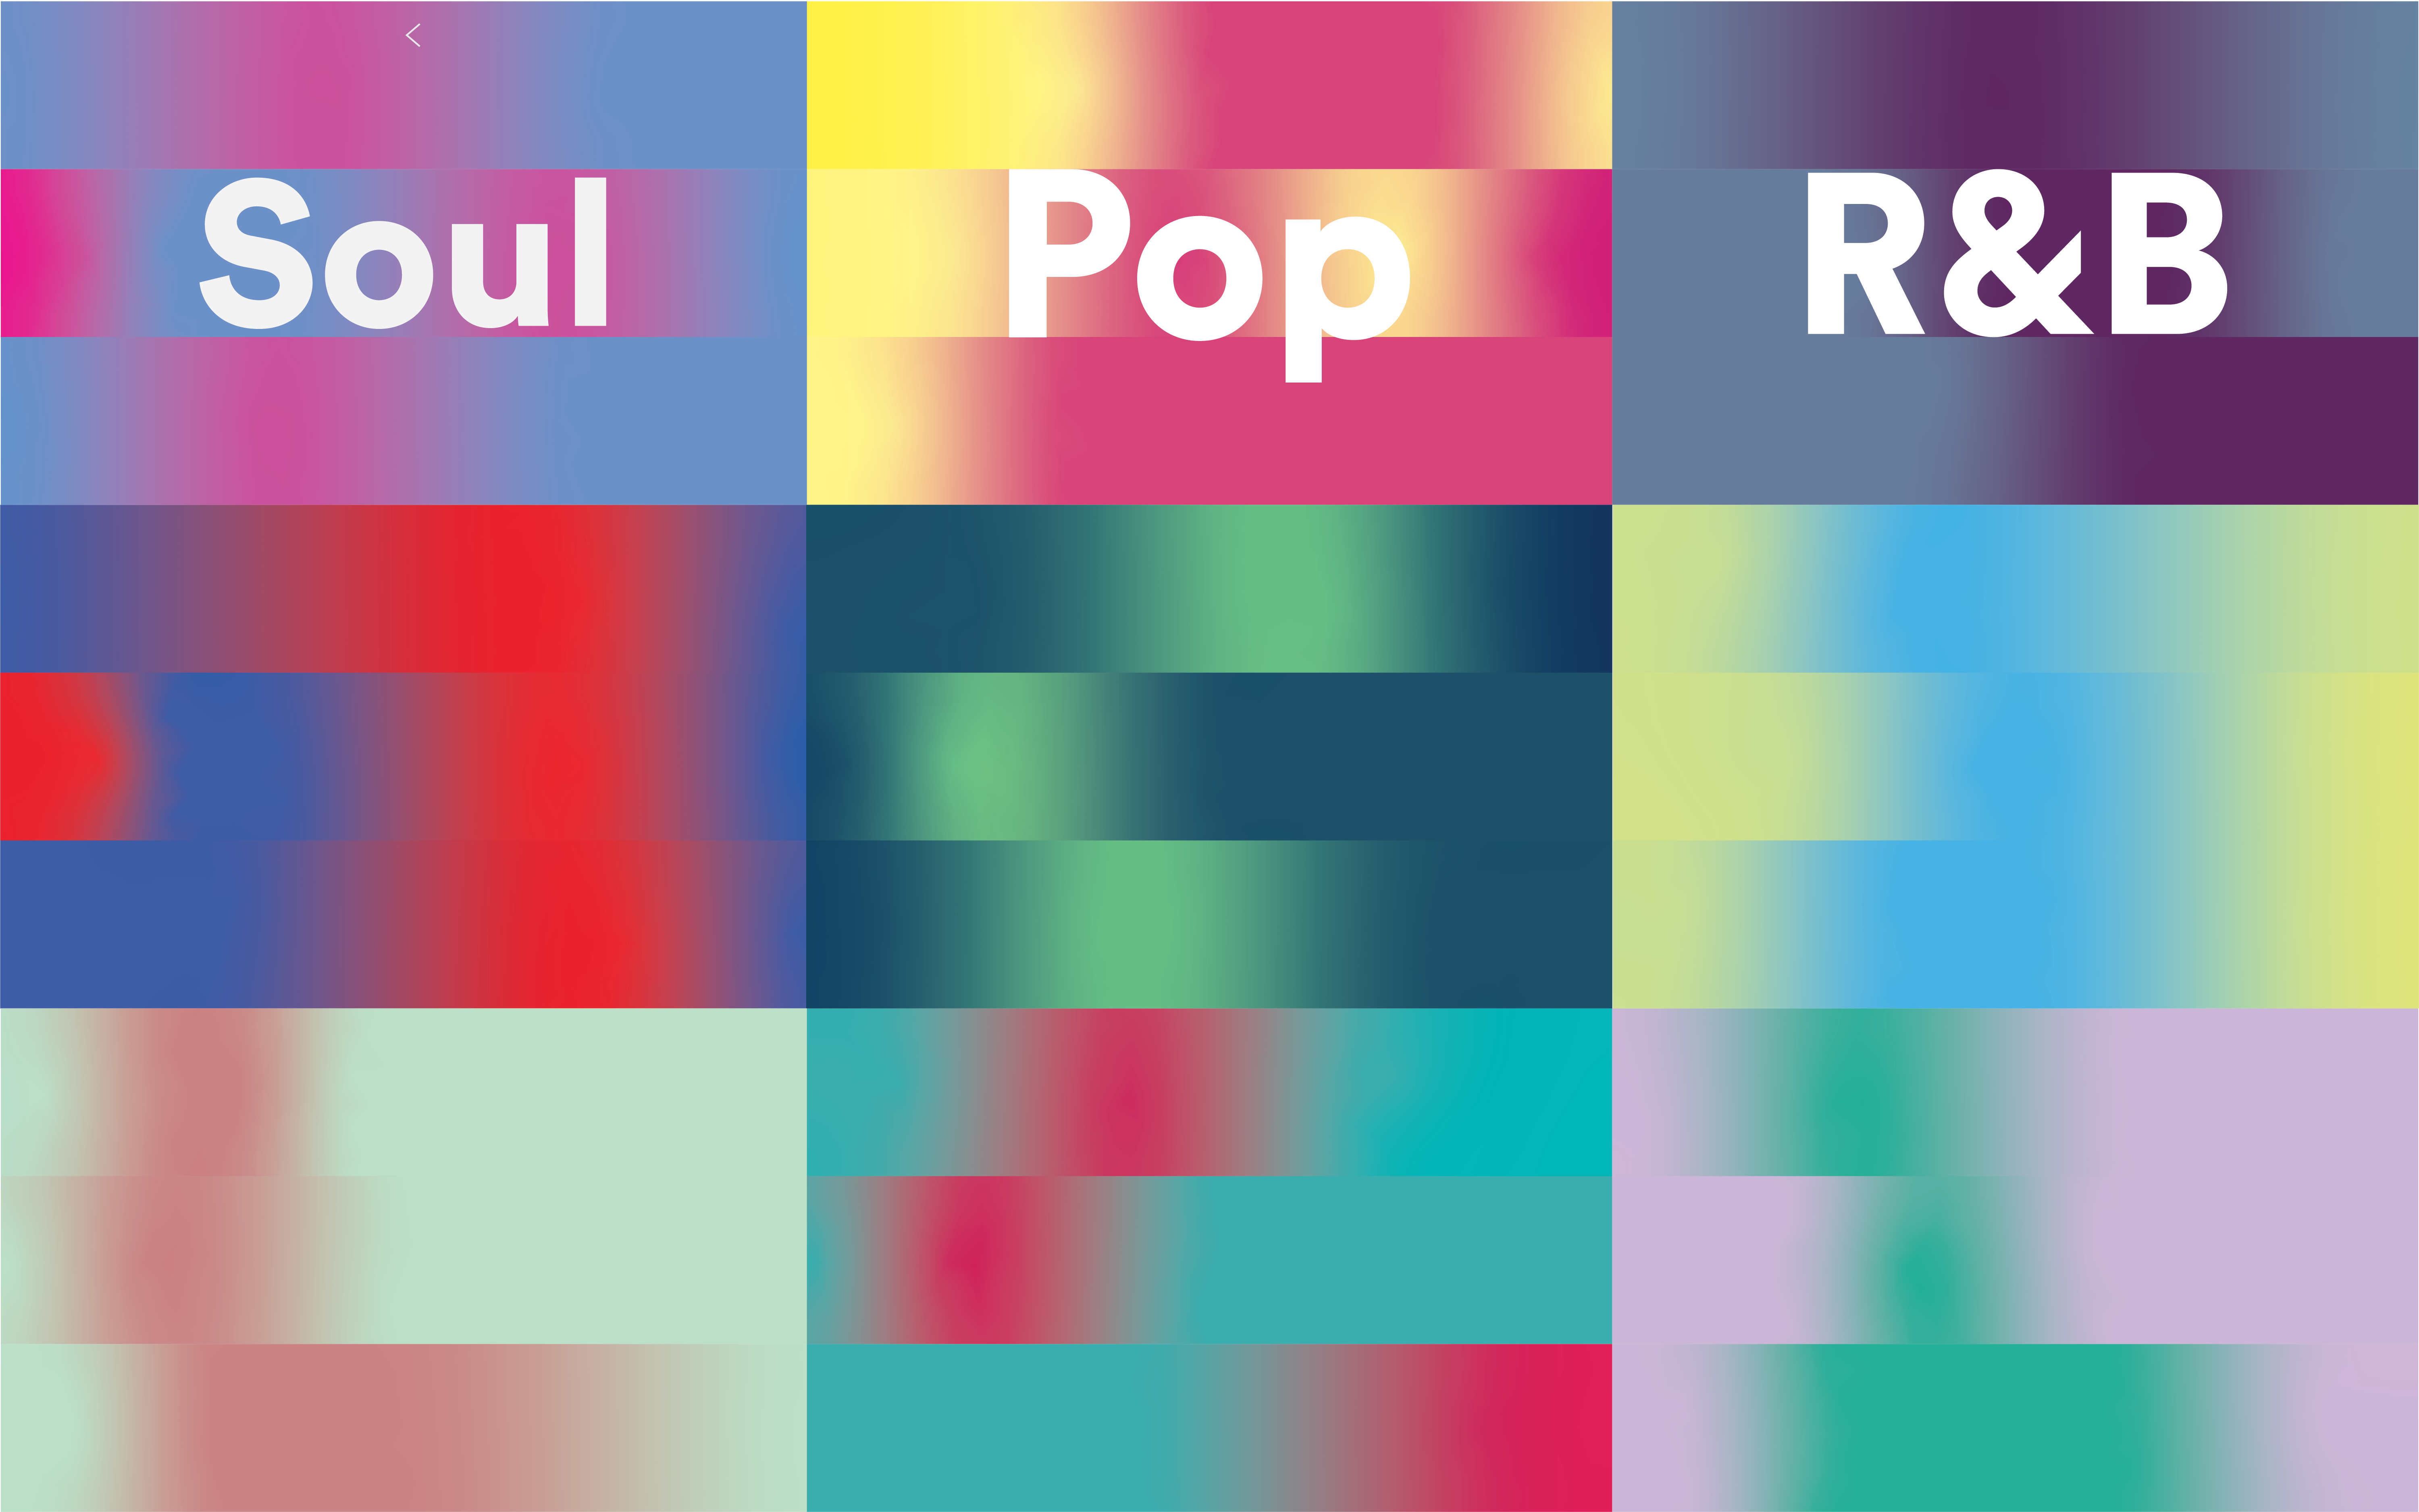
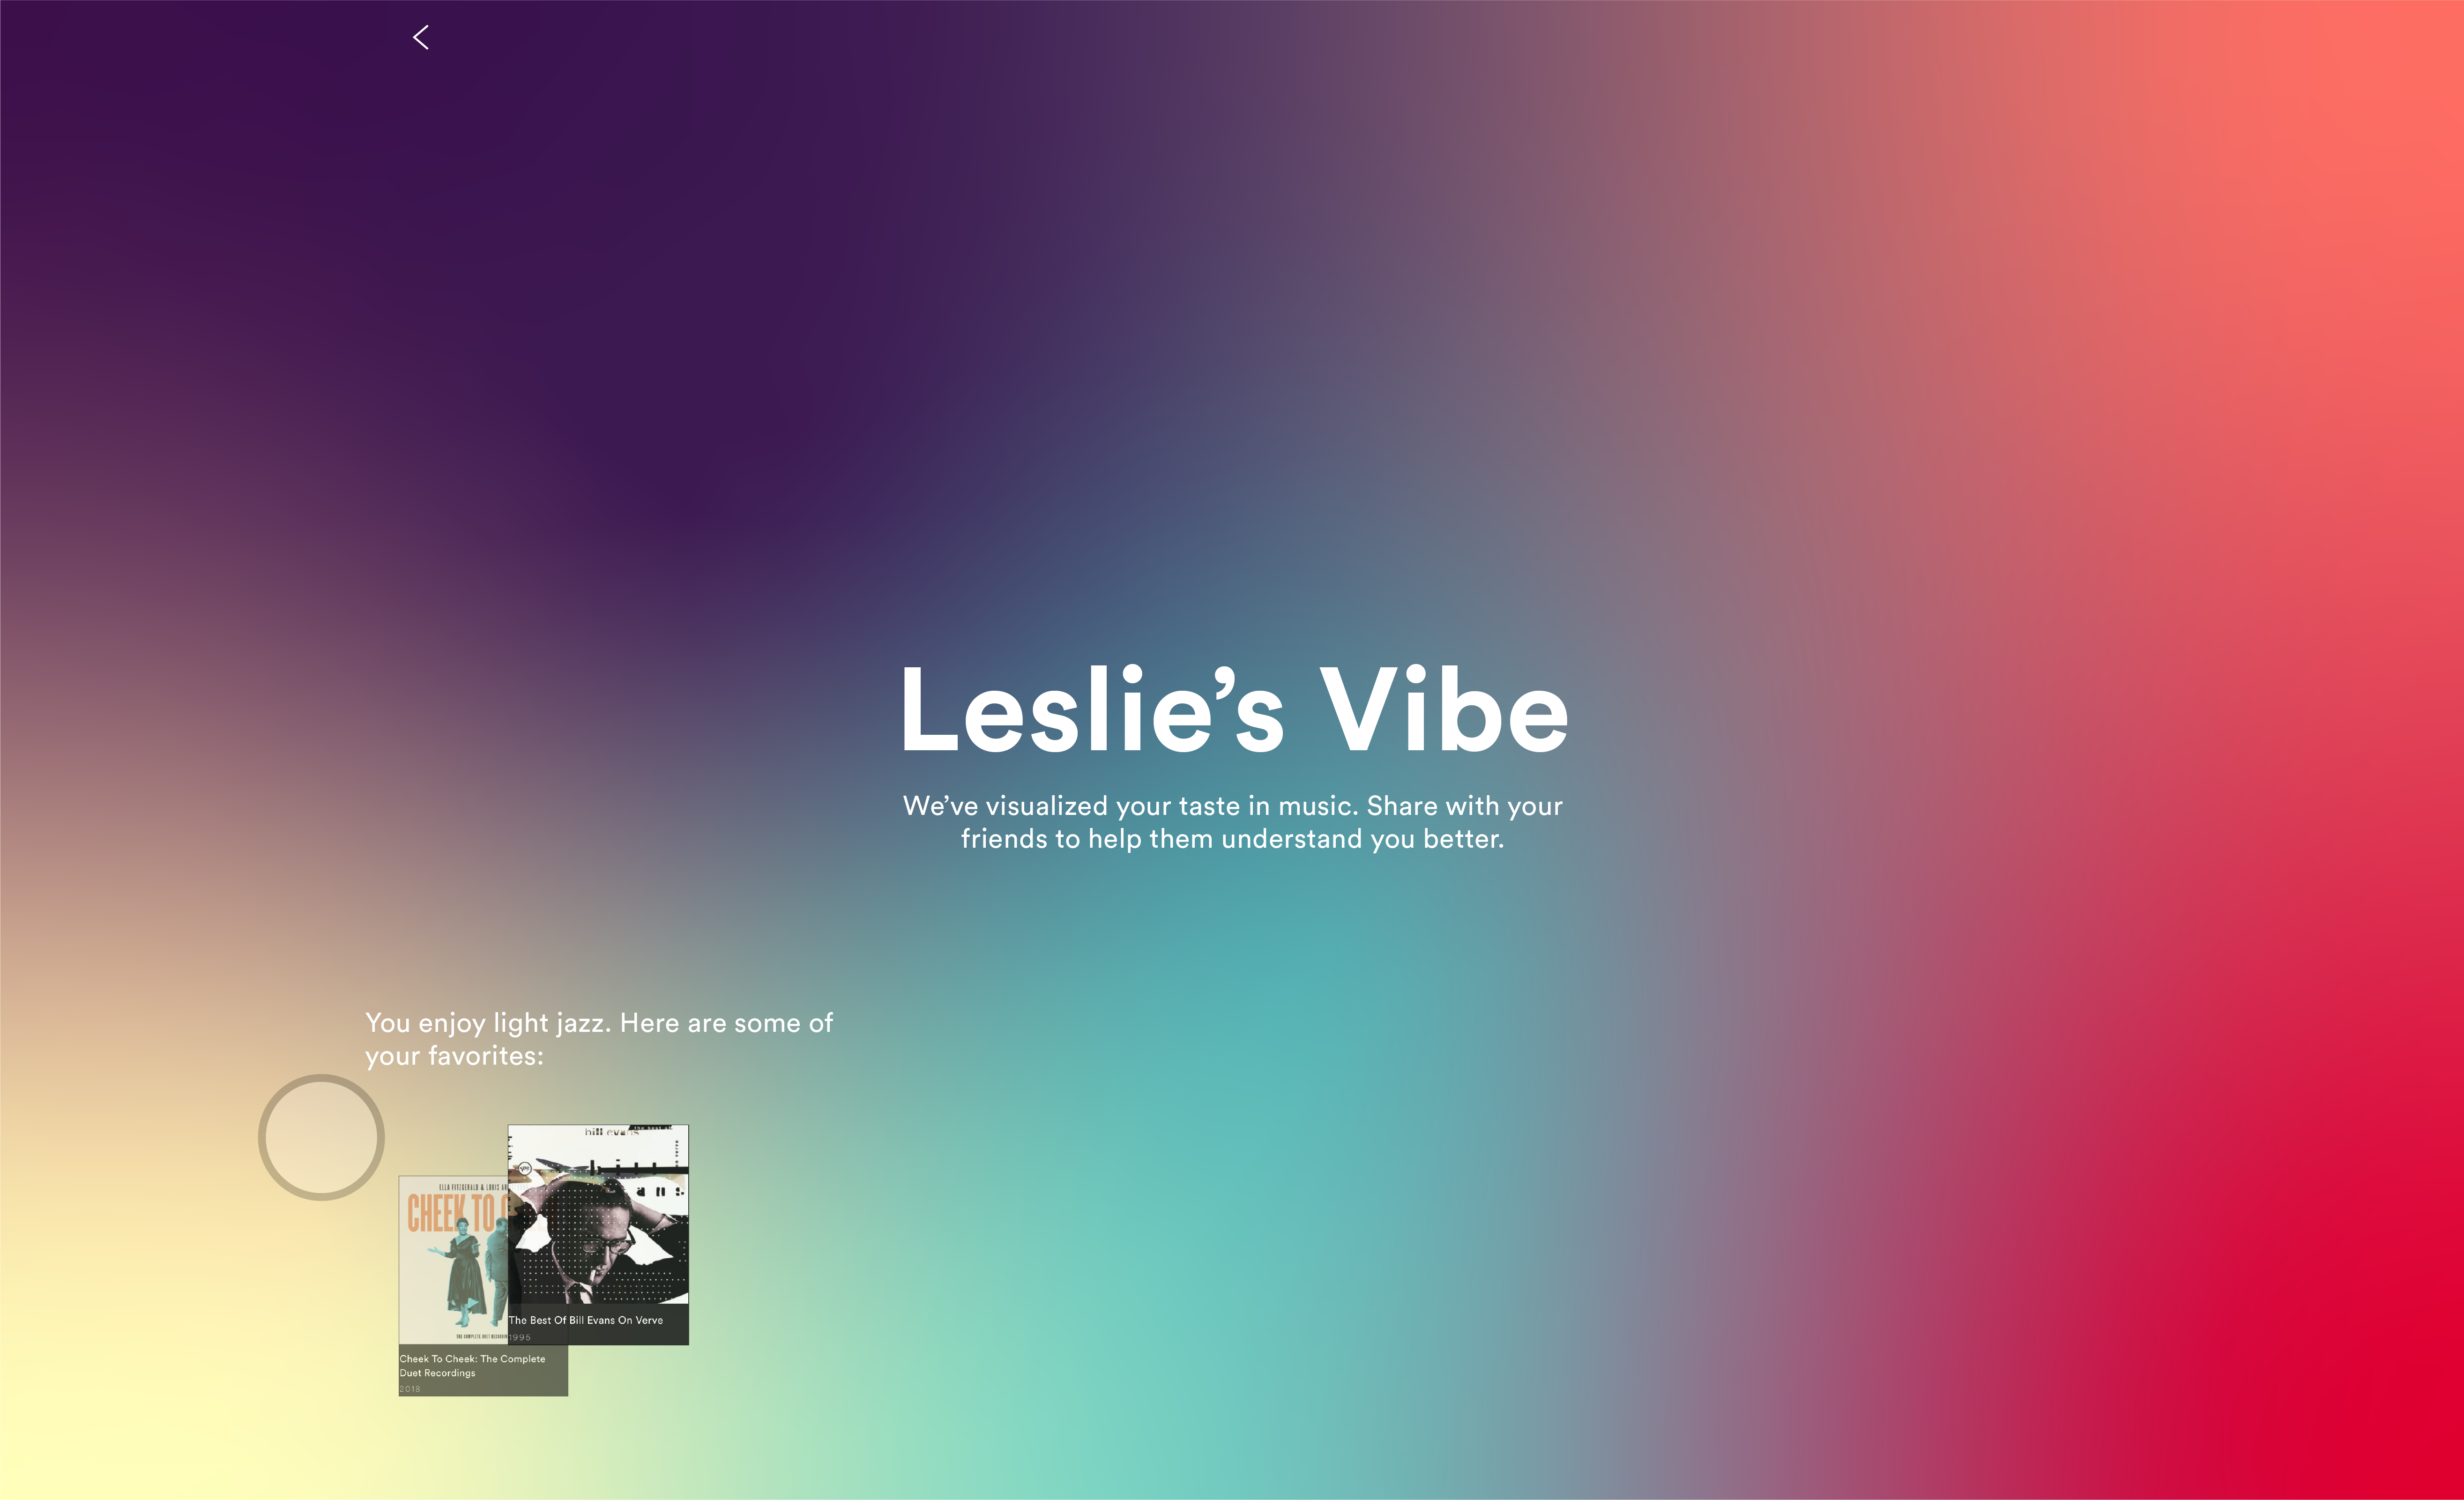
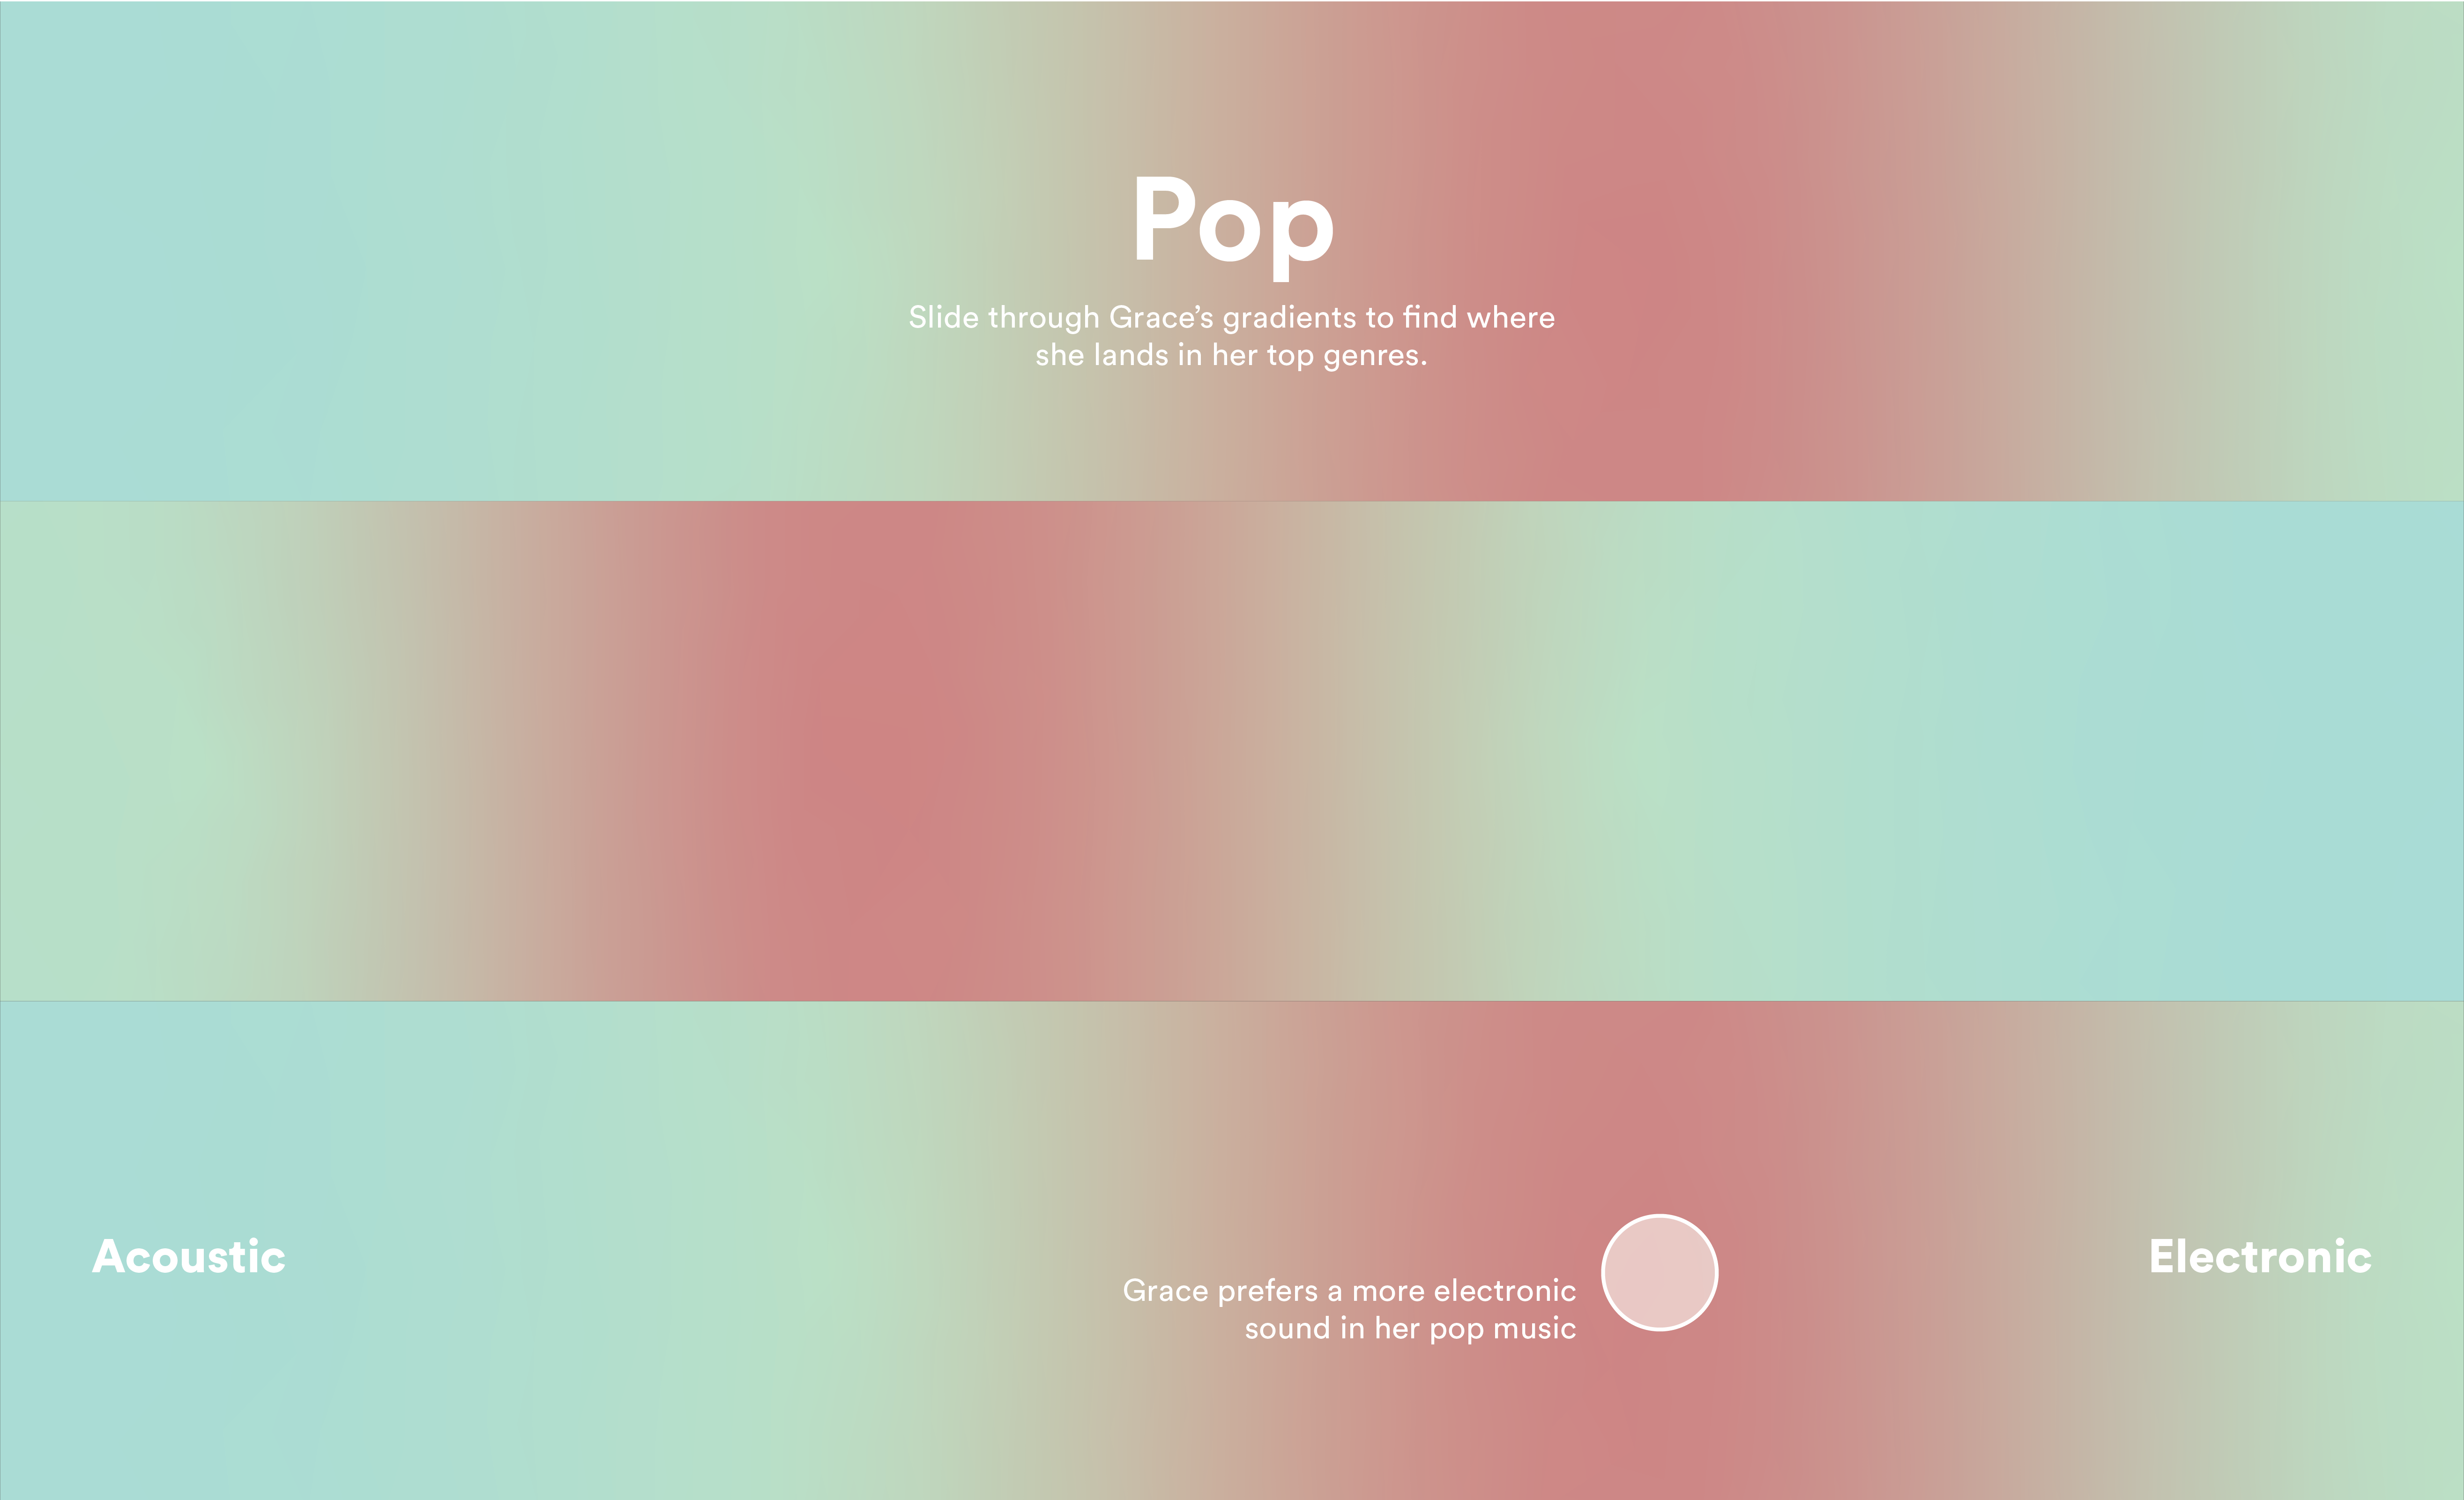
Using color and music classification, I sorted music by era, tempo, and energy to create a music sharing feature to Spotify’s current design. See my coded data (using p5.js) visualization here
I found it vital to create a way to see how our friends listen, creating more intention in people’s shared content.
My preliminary sketch process involved figuring out ways in which music classification made sense. To create my potential algorithm, I researched semantic differentials, which is a technique in which 2 words, neither one more positive nor negative than the other, are used on ends of a spectrum. I began to categorize and plot genres in terms of tempo, energy, and era.
![]()
Digital Iterations
![]()
![]()
![]()
Final Frames
![Messaging System]()
![Genre Gallery]()
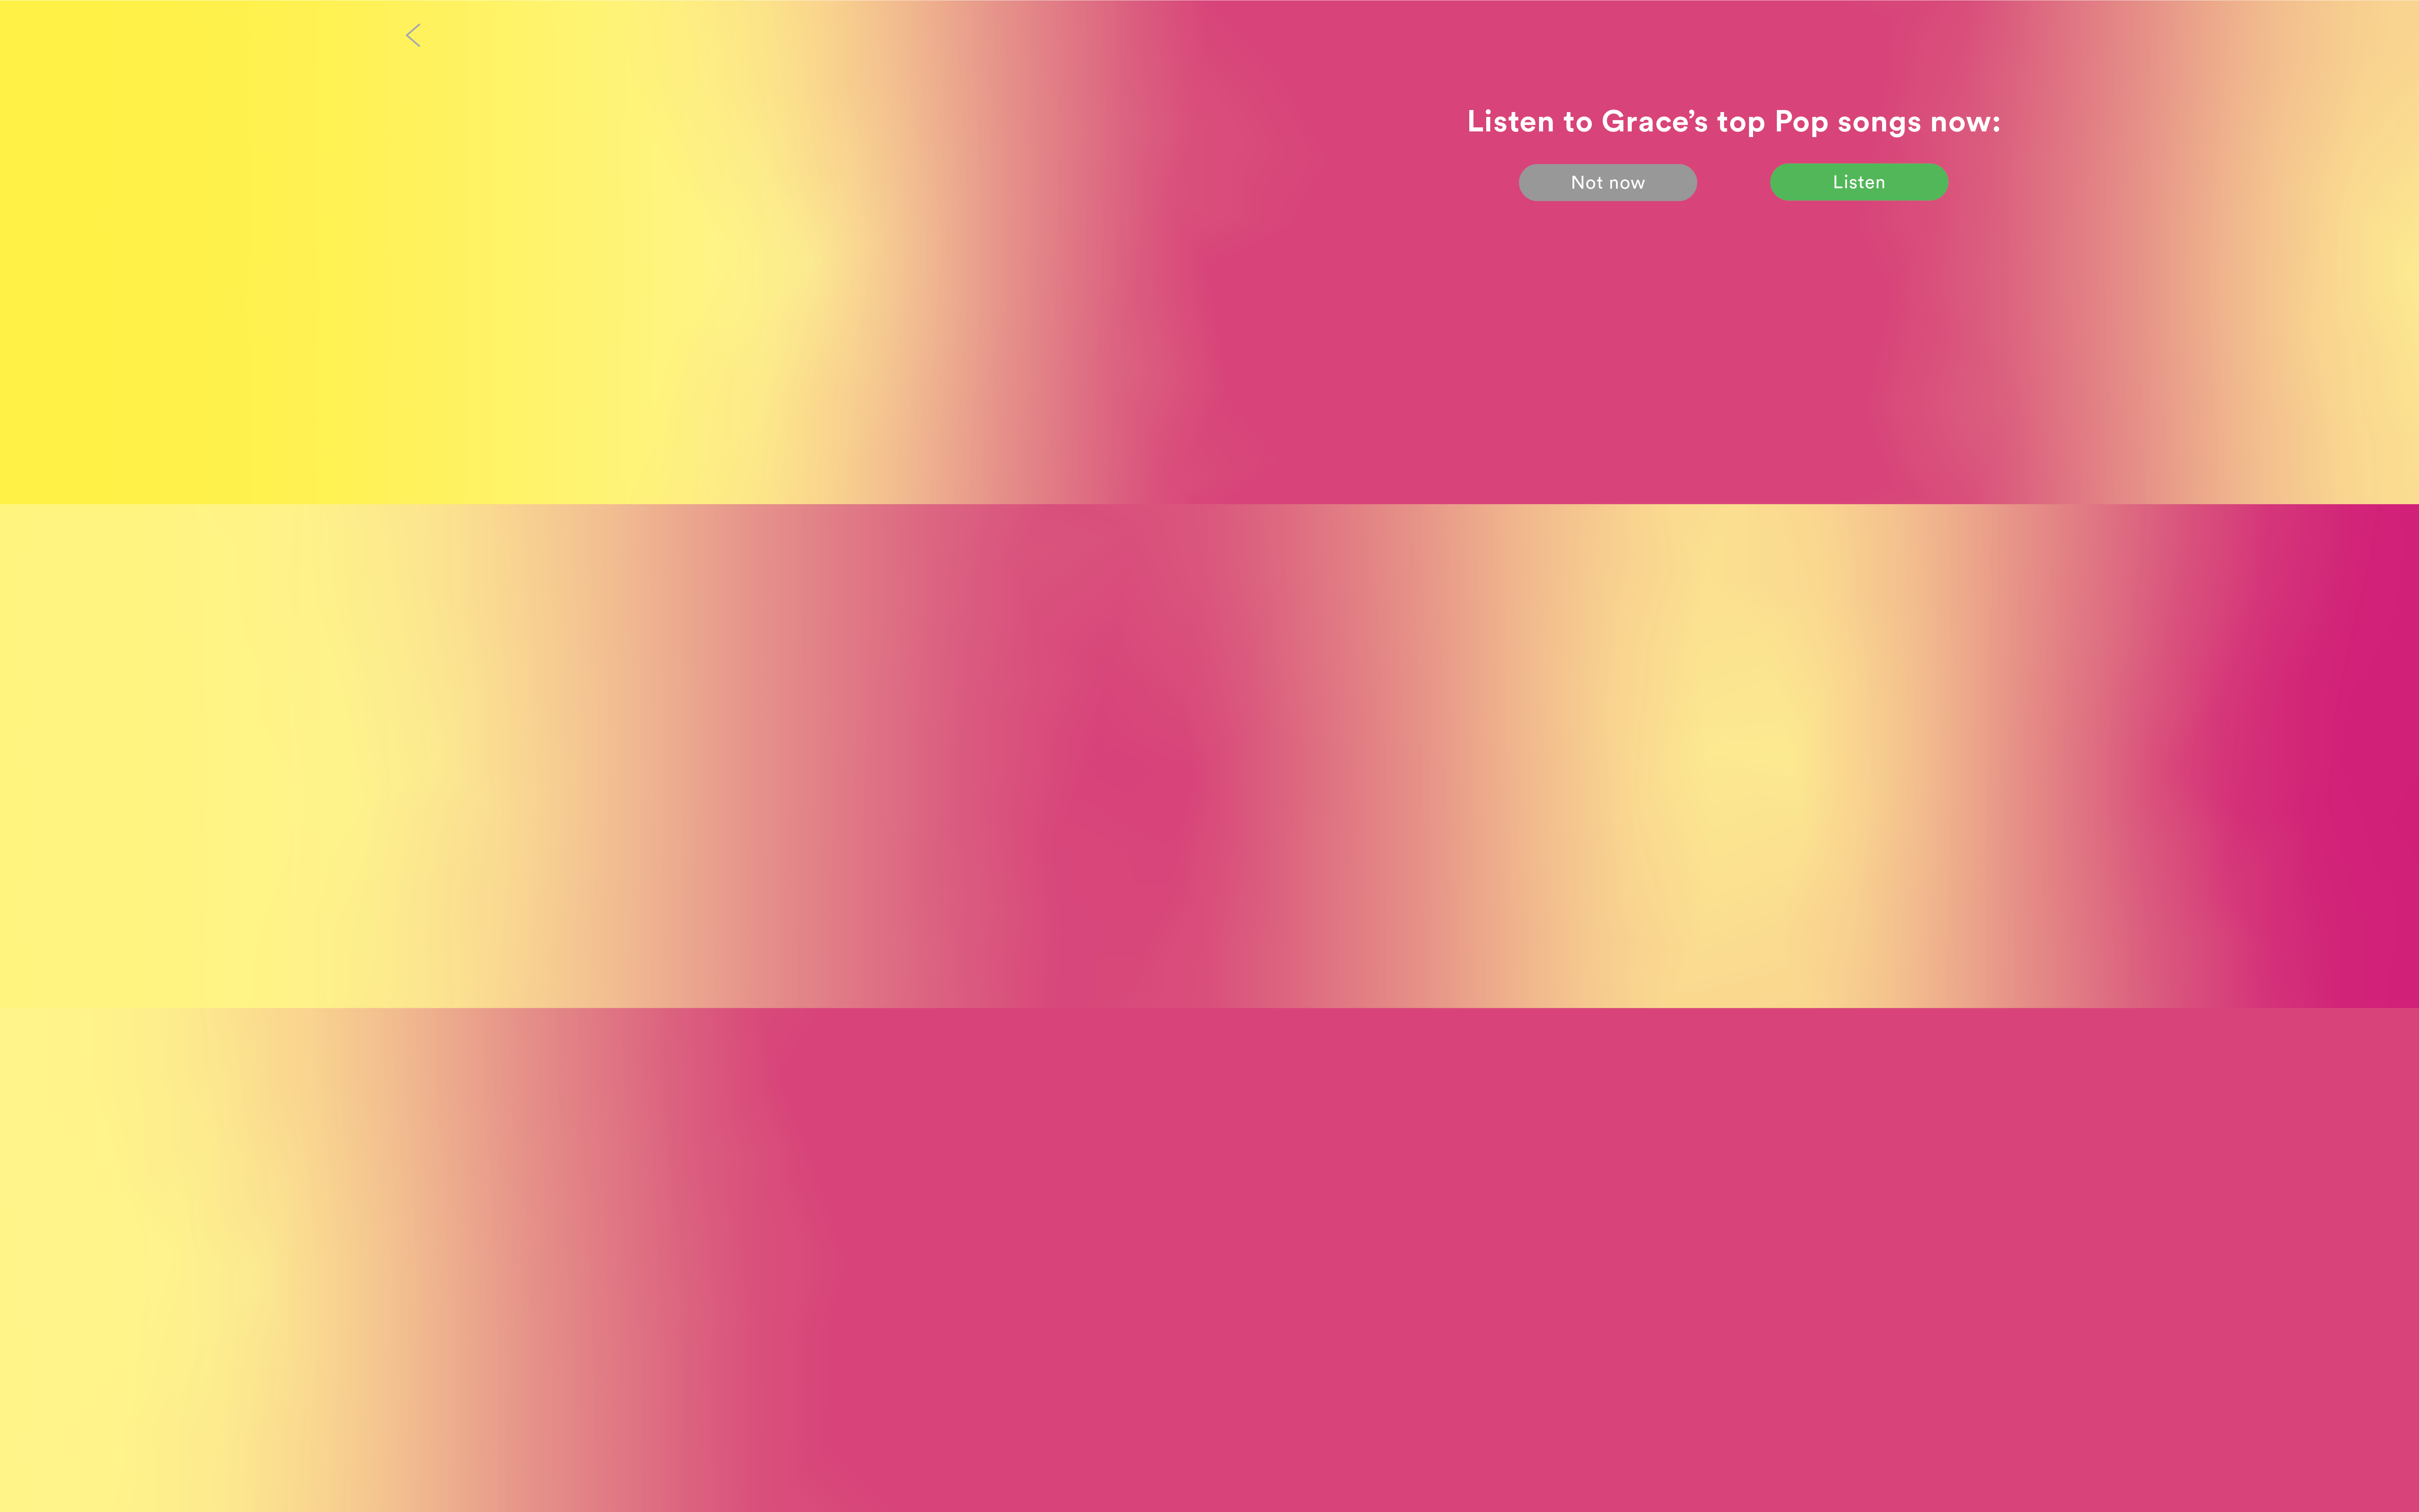
![Top Songs]()
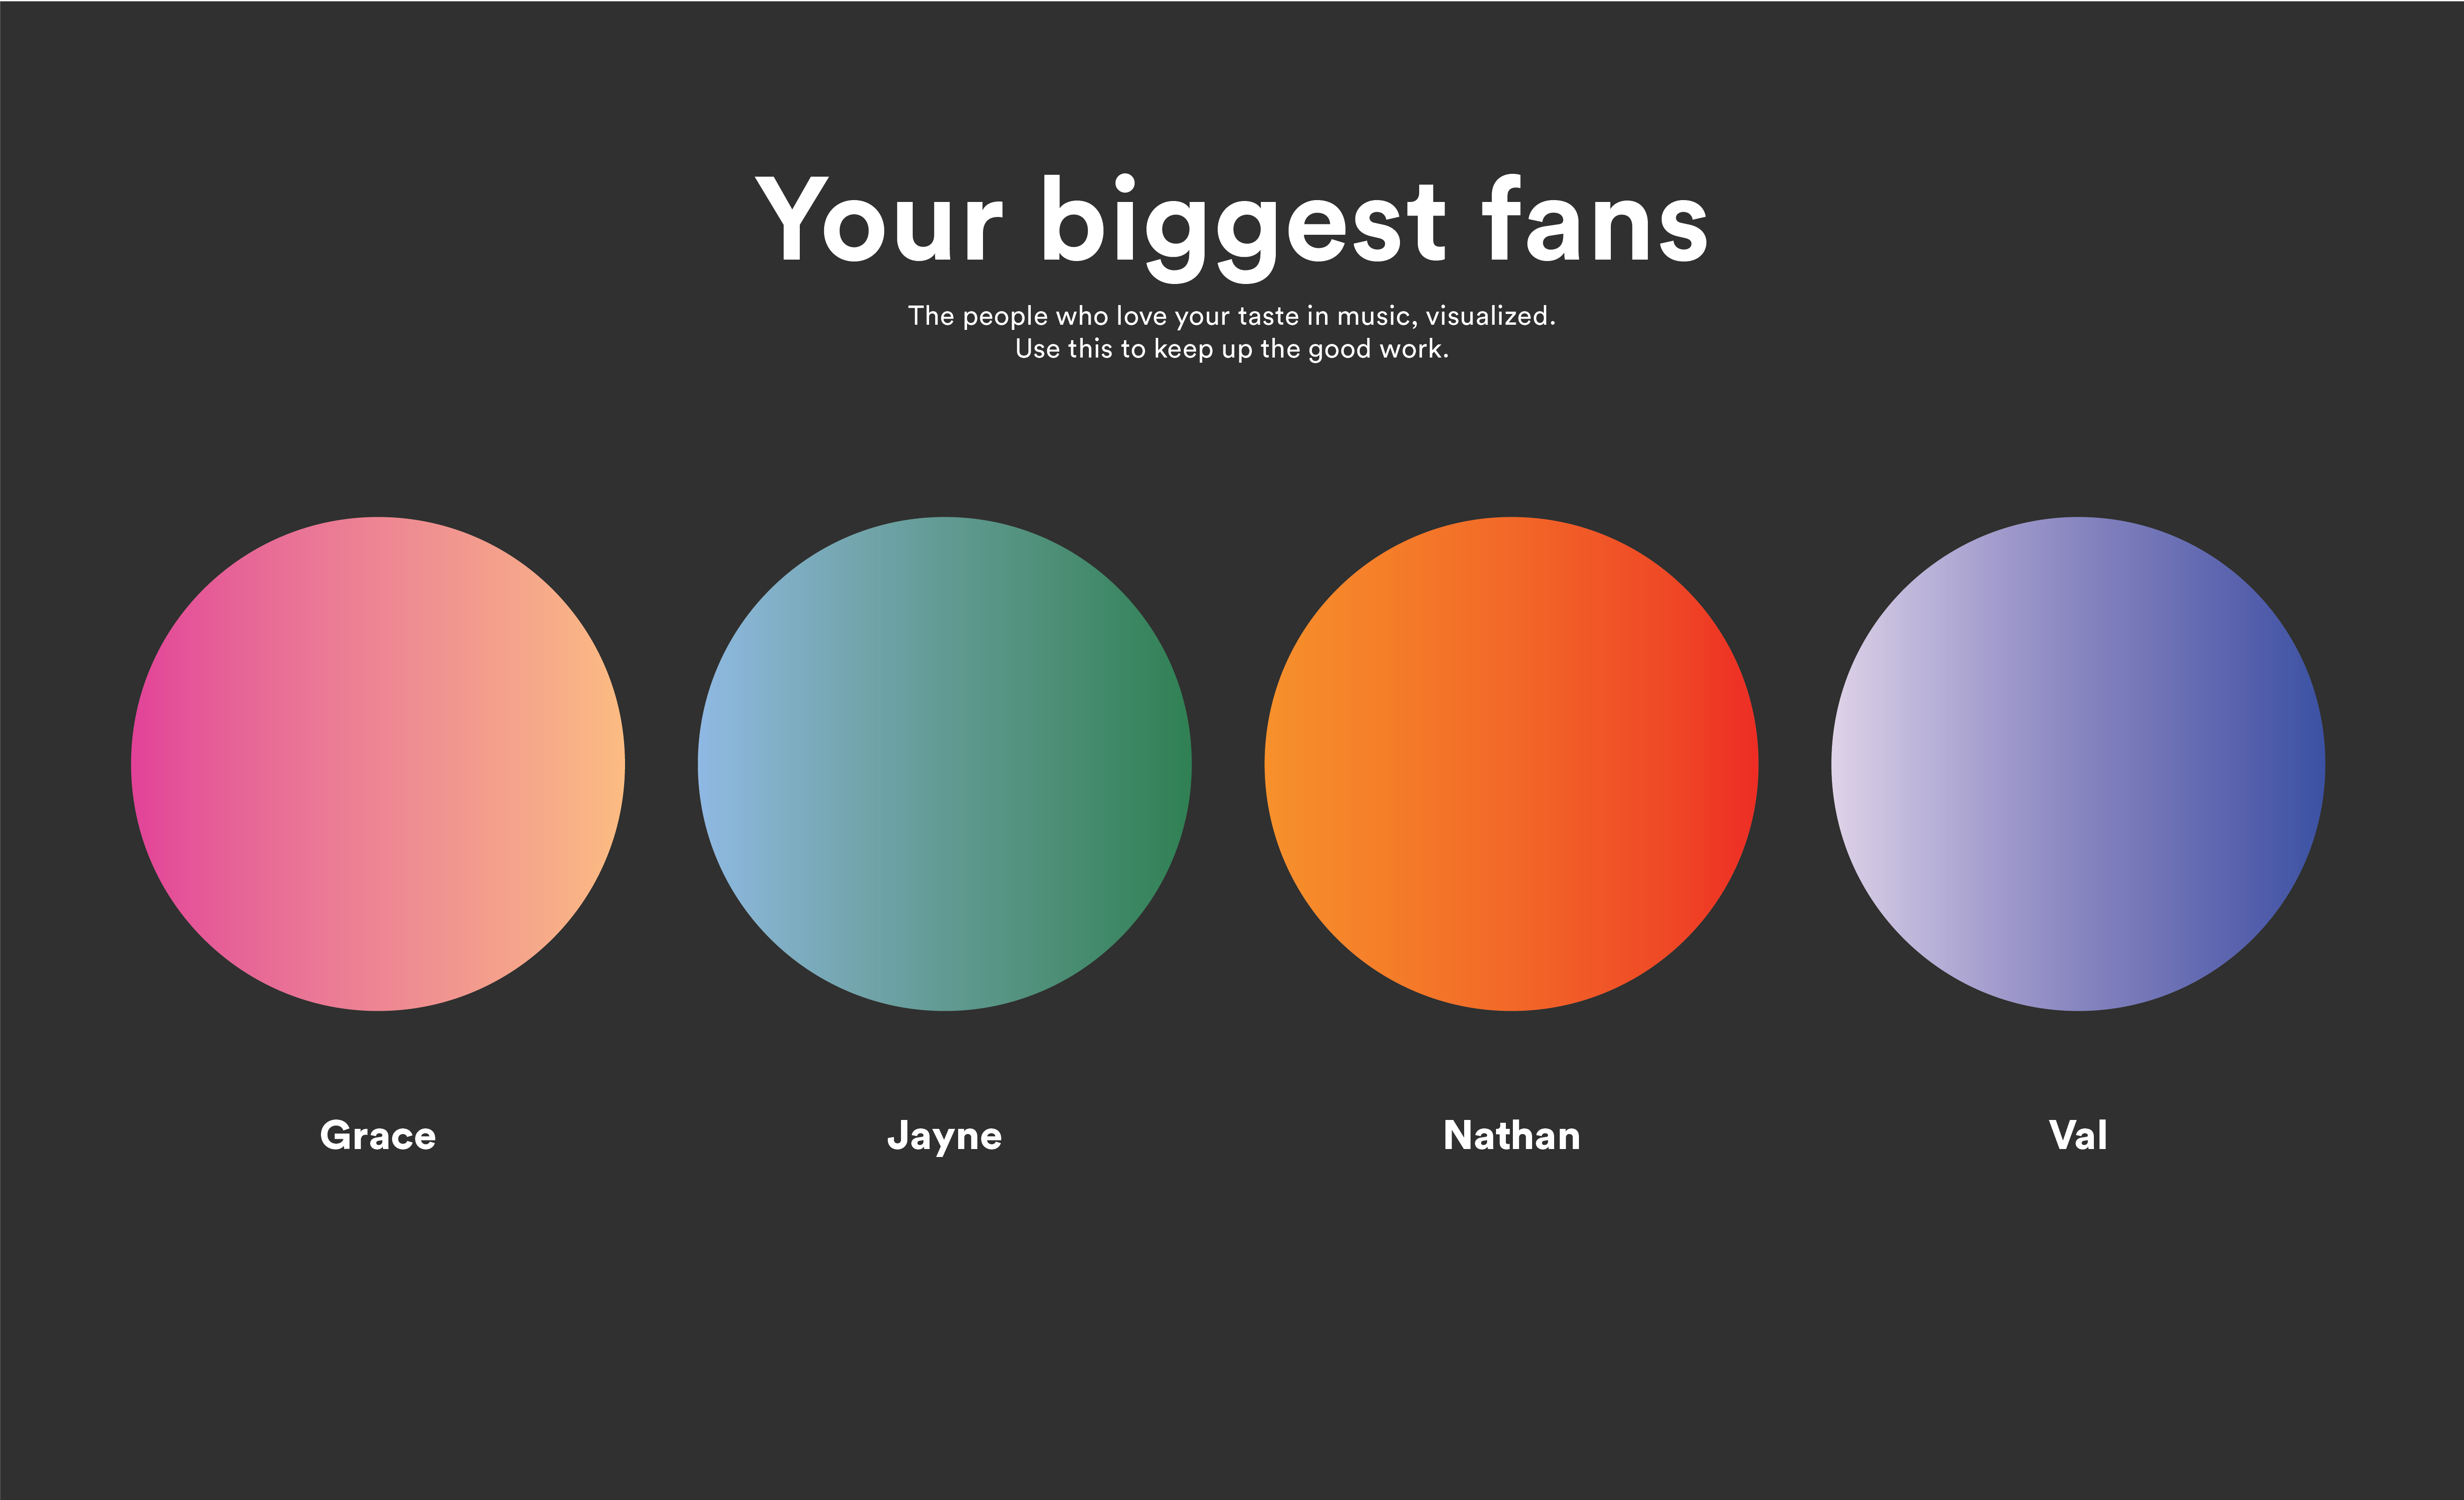
![Confirmation of Choice]()
Final Frames
